Profile
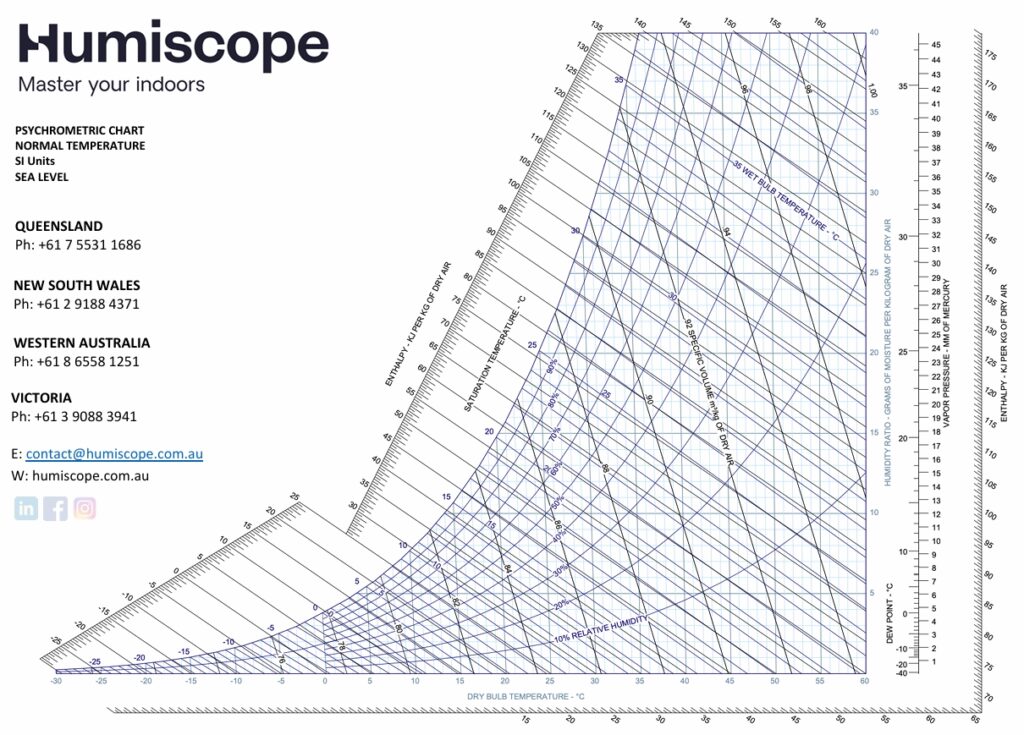
Psychrometric charts are an essential tool for HVAC engineers and technicians. They provide a visual way to understand how air properties like temperature, humidity, dew point, and enthalpy interact in different air-conditioning and ventilation processes. Here’s a simple overview of common HVAC processes you can map using a psychrometric chart:
-
Cooling & Dehumidification
Cooling and dehumidification are key for air conditioning systems. On a psychrometric chart, this process is represented as a down-left diagonal line, showing how hot, humid air is cooled and moisture is removed. You can also use the chart to monitor dew point, ensuring coils are designed to remove moisture efficiently and prevent condensation issues.
-
Heating
Winter heating raises air temperature without adding moisture. On the chart, this is a horizontal line moving to the right.
-
Humidification
Adding moisture to the air is essential in dry climates or controlled environments. Humidification appears as a vertical line moving upward on the chart.
-
Evaporative Cooling
Evaporative cooling cools air by adding moisture without mechanical refrigeration. This process follows a diagonal down-left path at nearly constant enthalpy.
-
Mixing of Air Streams
Air handling systems often mix return air with outdoor air. On a psychrometric chart, mixing is represented by a line connecting the two air conditions, helping you calculate the resulting mixed air temperature, humidity, and dew point before it enters coils.
-
Comfort Evaluation
Psychrometric charts also help check thermal comfort zones. By plotting indoor, supply air, and dew point conditions, you can ensure temperature and humidity levels stay within the ideal comfort range for occupants.
-
Troubleshooting
Technicians can plot measured dry-bulb, wet-bulb, and dew point temperatures on the chart to diagnose issues and confirm coil performance.
The Humiscope psychometric charts come with instructions on how to use plus an offer of one-to-one advice on how to use the chart for your project
Image description: Understand what is happening in HVAC processes with psychometrics
Check out their business profile here
Have a go of the chart here Toolkit & Resources — Humiscope
Reviews
Comments are closed.